Primedope powerful poker tools and more great stuff
Updated: 20. May 2021
93 Comments
By Primedope
Poker Variance Calculator
This variance calculator and simulator for poker is handy and easy to use. Just enter your winrate, standard deviation and the amount of hands to simulate. You'll most certainly get insightful results.Read below how to use this simulator.
Winrate in BB / 100
Observed winrate in BB / 100 (optional)
Standard deviation (»?«)
Example for standard deviations
NLH full ring: 60-80 BB/100
NLH 6-max: 75-120 BB/100
PLO full ring: 100-140 BB/100
PLO 6-max: 120-160 BB/100
stat can be found in PokerTracker or HEM in BB / 100
Number of hands to simulate
20 samples and confidence intervals
Hit "Calculate"!
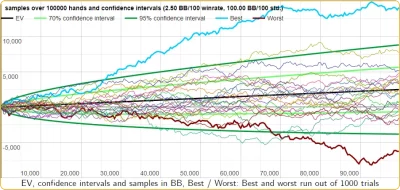
EV, confidence intervals and samples in BB, Best / Worst: Best and worst run out of 1000 trials
Variance in numbers
Detailed sample with downswings
Hands: 1.0 Million hands
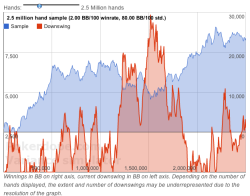
Winnings in BB on right axis, current downswing in BB on left axis. Depending on the number of hands displayed, the extent and number of downswings may be underrepresented due to the resolution of the graph.
Downswings in numbers
How to use my Poker Variance Calculator?
This section will explain how the calculator works and what the numbers and charts mean.
Enter the data
Hop over to the Variance Calculator page and enter your winrate, standard deviation and the number of hands you want to simulate. You can ignore the field observed winrate, we’ll get to its purpose later. Once you have entered the data, hit Calculate and the let the Calculator do its magic.
20 samples
The first thing the Variance Calculator does, is to run 20 samples over the amount of hands, winrate and standard deviation specified. It’ll also calculate the expected winnings over the amount of hands. This number will appear as a rather boring straight and black line in the graph. Thirdly the calculator displays the 70% and 95% confidence intervals as light and dark green curves. What you need to know about them is that at any given time your winnings will be within these intervals with a probability of 70% and 95% respectively. They basically show, how much variance you should expect to see.
Variance in numbers
Below the first chart the Variance Calculator compiles a neat list of additional information:
EV: win rate entered above
Standard deviation: standard deviation entered above
Hands: number of hands entered above
Expected winnings: estimated winnings over the simulated amount of hands
Standard deviation after X hands: This number shows by how much your actual results will differ from the expected results on average. The first number shows the absolute value, the second translates this number into BB/100, showing the impact on your winrate.
70% confidence interval: Your actual results over the simulated amount of hands will be within this interval 70% of the time. The first interval shows absolute numbers, the second translates those into BB/100, showing the 70% confidence interval for your winrate.
95% confidence interval: Same as the above with 95% certainty. Meaning: 19 out 20 times your actual winnings will be within this interval.
Probability of loss after X hands: probability that you will experience negative winnings (meaning: losses) over the amount of hands.
Probability of running at or above observed win rate …: If you entered an observed winrate, this number will show you the probability that you will experience a run at or above this winrate over the amount of hands.
Probability of running below observed win rate …: Same as above – probability that you will experience a run below the observed winrate over the amount of hands.
Minimum bankroll for less than 5% risk of ruin: the bankroll needed to have a risk of ruin of less than 5%
Detailed sample with downswings
This chart simulates a single run over 100 thousand up to 10 million hands with the winrate and standard deviation entered above. You can choose how many hands to simulate by moving the slider. Apart from showing a single sample, this graph also shows some insightful information about downswings. The red area shows for any given point, how much the sample is currently away from its previous peak, meaning it tracks downswings. This chart uses two vertical axes. While the sample winnings have their scale on the right axis, the downswing tracker has its scale on the left axis. In this example the simulated player ended up with winnings over 25,000 big blinds after 2.5 million hands but had to deal with a nasty downswing of almost 10,000 big blinds between hand 1.2 million and hand 2 million.
Downswings in numbers
The last section of the Variance Calculator sheds some more light on potential downswings. Therefor 100 million hands are simulated and all downswings over this simulation are tracked.The first table shows the extents of downswings. It shows how often the simulated player was stuck in a downswing of at least X big blinds. For example (1000+ BB – 31.77%) means the player was in the middle of a downswing of at least 1,000 big blinds 31.77 percent of the time.The second table shows how long downswings last on average. For example (50000+ Hands – 15.81%) means the simulated player was in a downswing over at least 50,000 hands 15.81 percent of the time. For the purpose of these calculations a downswing is defined as any period where the current total winnings are below the maximum previous total winnings. Meaning, by this definition a downswing is not over until the player has fully recovered its losses. In general these simulations underestimate the extent of downswings, but the numbers should still give you a decent idea of the vastness of downswings you should expect.
Should you have any questions, encounter any errors or have ideas for improvements, please let me know.
I am a part of digital marketing strategy.We are providing the quality sites for guest posts. a If you are looking for guest posts sites ? then you are in the right place.
This guest post strategy increases your website traffic and visitors.
Just let me know which sites you are interested in and I will provide you my best.
Best Regards
Sean Fraley
24. October 2021 04:19
Would it be possible to get the ability to set a target risk of ruin?
Ori13
18. May 2021 21:58
it would be really awesome if there was an option to input a bankroll amount and calculate the risk of ruin based on the input bankroll
Hi Torsten, the calculator runs rather simple Monte Carlo simulations assuming that cash game results follow the normal distribution when repeated often enough and over a long enough time frame.
Great job on the tool! Maybe you could add an input box for rake or give choice to choose site / limits, tough of course it’s possible to just add the rake back to our win rate. Cheers
For variance purposes you should always consider your win rate with rake (and possible rake back) included.Otherwise you’d heavily overestimate your EV and underestimate the variance.
Katie
23. September 2020 13:06
Is it possible to get Risk for ruin shown to 0%? Is it possible to get it shown over a hand period?
A 0% risk of ruin at infinity is unachievable unless one starts with an infinite BR. For risk of ruin shown over a hand period you can use the formula I gave in the comment below.
Well, yes, you can just add the rake to you win rate to see the difference. If you have a win rate of 3BB/100 and pay 5BB/100 rake, your win rate before rake is 8BB/100.
The variance is independent of your win rate though. Of course your EV will increase, but the size of the confidence intervals for example will stay the same.
Last edited 1 year ago by Primedope
Noah
25. June 2020 06:17
Hi – does anyone know the standard deviation of evBB/100 hands for 6max no-limit? Seems like it should be less than the SD of winrates that aren’t adjusted for all-in equity.
Standard Deviation heavily depends on your play style. More aggressive players tend to have much higher SD/100 than super tight players.
I just went through my database with a couple of million cash game hands to get some detailed numbers about the standard deviation of all players in the database. (Regular cash game, not fast fold.) I filtered for number of players and removed all players with less than 1000 hands.
Those are the standard deviations the players in my database had:
Games with 2 players
Median Standard Deviation: 93
95% Interval: 62 – 156
Games with 6 players
Median Standard Deviation: 86
95% Interval: 56 – 140
Games with 9 players
Median Standard Deviation: 86
95% Interval: 57 – 144
95% Interval means that 95% of all players had a standard deviation between those two values.
As you can see, standard deviation doesn’t change much between 9 player games and 6 player games.
Edit: This didn’t really answer your question though.
Go into detail regarding the standard deviation when looking at evBB/100 is a bit tricky. Unfortunately, PokerTracker doesn’t have a StdDev(evBB/100) readily available.
But I think we can get a decent approximation when we just remove all hands with an all-in and call before the river when calculating the standard deviation. At least this will show the maximum impact all in hands have on the standard deviation.
In my database I have 3.06 Million hands (NL100) with 5 or 6 players. Only 29k of those (0.9%) had an all in before the river and a showdown.
Again I filtered for all player with at least 1k hands and removed all hands with all in before the river & showdown. Those are the numbers I got:
Hands with all in & showdown: 29,350 Hands without all in & showdown: 3,058,874
Median Standard Deviation for hands without an all in & showdown: 67
95% Interval: 41 – 112
Meaning: We can compare this with the numbers above for Games with 6 players. StdDev(evBB/100) is at most 28BB/100 lower than StdDev(BB/100), on average not more than 19BB/100 lower.
“Winrate / 100” means how much you win over the course of 100 hands statistically. Winnings are measured in big blinds. Lets say you’ve played 10,000 hands of $1 / $2 NLH and won $500. That means you have won 250 big blinds over 10,000 hands. This is equal to 2.5 big blinds per 100 hands.
Nikola
15. November 2017 22:36
How do you calculate standard deviation after X hands?
the standard deviation for a single outcome is always constant. What youre looking for is the standard deviation for the mean. It follows the following formula: Variance of the mean result after N hands = (1/(N squared)) * Variance of the sum N would be the number of hands and the “variance of the sum” would be the sum of the variances of all the outcomes. For example the variance for a single fair coin flip is 0.25. If you want to know the variance of the sum of 10 coin flips you do 0.25 * 10 = 2.5 2.5 is the variance of the sum of 10 coin flips. The same goes for poker hands. The variance for 100 poker hands in NLH 6max is, say, 10000 (100 squared). To calculate the variance of the sum for 10 thousand hands you have to think how many groups of 100 hands does 10000 have? well, 10000/100 = 100 There are 100 groups of 100 hands in 10000 hands, which also means there is 100 times the variance of the sum of 100 hands, so: 100 * 10000 = 1000000 One million is the variance of the sum of 10000 hands. You divide this number by N squared(10000 squared) and you get the variance of the mean: 1000000 / 100000000 = 0.01 0.01 is the variance of the mean for 10000 hands; which is the same as saying 0.01 is how much your observed results will differ from the mean when looking at a sample of 10000 hands. as you increase the number of hands the variance of the mean approaches zero: for 10000 hands = 0.01 for 100000 hands = 0.001 for 1000000 hands = 0.0001 etc.
w34z3l
11. October 2017 19:04
Btw, industry standard is to use BB to describe “big bets” and bb to describe (big blinds). Everything is super misleading.
No. Did you forget that the Gamblking Theory book states:
Special Note: It has been pointed out to me by Bruce Zastera, one of the most knowledgeable posters on our forums at http://www.twoplustwo.com, that it is also possible to go broke before reaching the number of hours at which we evaluate the probability of a loss, as well as after that time, and this problem is more acute at the 95 percent level than I originally realized. This means that these tables are significantly underestimating by a factor of about 2 the amount of bankroll needed to only have a 5 percent chance of going broke. Fortunately, this problem mitigates as the probability of going broke is reduced. Thus the Bankroll Required to Assure a Win tables do contain solid estimates and produce a risk of ruin of approximately 1.1 percent, but the 95 percent tables should probably not be used.
Of course I didn’t forget that note. I wrote some of it. It in no way changes the fact that the calculations in that section are no way to compute the bankroll requirement for a desired risk of ruin. That’s because the number of sigmas in your derivation does not translate to a probability of ruin, for the same reason that the 95% confidence interval in this blog has nothing to do with a 5% risk of ruin. Moreover, this fundamental problem does not “mitigate as the probability of going broke is reduced”. Your computation for the “bankroll required to assure a win” ignores 88% of the possible ways we can go broke. That number gets worse as the risk of ruin is reduced. I’m sure you understand that a mathematical model should capture the dominant effects rather than ignoring the dominant effect.
We need to be clear what was meant by “the problem mitigates as the probability of going broke is reduced”. The bankroll needed for a 5% risk of ruin is about 2.2 times the bankroll that your method would compute. If we want a 1% risk of ruin, the bankroll required is about 2 times what your method would compute. If we want a 0.13% risk of ruin, the bankroll required would be about 1.5 times what your method would compute. That’s about as small a risk of ruin as most people would care about, yet the bankroll is still off significantly. There’s not a lot of mitigation.
The actual risk of ruin produced by your bankroll in that last case, which you describe as “the bankroll required to assure a win”, would be about 1.1%, not 0.13%. The mitigating factor is that both of those numbers are relatively small. Lots of folks may not care if their risk of ruin is 1.1% or 0.13%, though I’m not sure everyone would describe a 1.1% risk of ruin as having assured a win. The 0.13% came from 3 standard deviations. You chose that as a way to include essentially all of a population as is common in statistics. Except you are considering the wrong population. We don’t want the population of positive results at a particular point in time assuming we can play through any draw down. We want the population of all random walks that never go broke. Using the former population for bankroll requirements and risk of ruin is mathematical nonsense.
BTW, the formula Pokerdope posted was well known long before Mathematics of Poker by Chen and Ankenman. It has been discussed by many at 2+2 since I introduced it there in the early 2000s or possibly even the late 1990s. It also appears in Douglas Zare’s poker book. Before that it was well known to the blackjack community, having appeared in papers by George C. and Patrick Sileo in 1989 and 1990 respectively . It was surely known in mathematics before that as the general expression is important in financial math, and it can also be obtained from the Weiner process. Deriving it from scratch isn’t that hard, but if you want a rigorous examination of the conditions under which it applies and how to modify it when those conditions don’t apply, see the essay “Gambler’s Ruin Revisited” in the book Optimal Play. There is also an analytical short term ruin formula for risk of ruin in a finite number of hands. I’ve only recently found a derivation of that one, and it is quite involved but still fairly accessible. Of course it’s quite straightforward to simulate these results to verify the accuracy of the formulas under a variety of conditions.
It’s good to see you back in these type of discussions. It’s a shame we don’t get to see more of your input as we once did.
Mason
BruceZ
14. May 2017 18:40
@Mason Malmuth:
The confidence intervals in his graph have nothing to do with risk of ruin. His graph is showing you a range of results assuming you can play through any drawdowns. IOW, if you lose your 5991 at some point, you can still keep playing, as if someone lent you additional funds. The positive portion of the graph includes the times you lost your bankroll and then recovered to finish positive. The risk of ruin formula as correctly given by Pokerdope counts these instances as a failure. A risk of ruin formula is not and cannot be based on confidence intervals.
Attempting to use confidence intervals to compute risk of ruin is a well known blunder. It is why the bankrolls in your book Gambling Theory and Other Topics for a 5% risk of ruin would actually give a 26% risk of ruin as was discussed on your site back in 2003 and countless times since on your Probability forum:
BTW, we developed a similar variance calculator on your site for tournaments which requires a different approach to risk of ruin.. It doesn’t have a web interface as of yet. It runs in R which is a platform for statistical computing which free and very easy to install. Here is a link to the script.
Thank you for answering my question. But since you’re showing a 95 percent confidence interval, aren’t you actually showing a graph that would correspond with a 2.5 percent risk of ruin while you’re using a formula that calculates a 5 percent risk of ruin? Put another way, wouldn’t a 90 percent confidence interval be the correct interval to use instead of the 95 percent confidence interval since 5 percent of the time your result will be above the confidence interval (and here you don’t care about bankroll since you’re such a big winner) but on the other hand, 5 percent of the time your result will be below the interval and that is what you’re interested in,.
In your example of a 2.5 BB winrate per 100 hands and a standard deviation of 100 BB per 100 hands how did you calculate (or estimate) the Minimum bankroll for less than 5% risk of ruin (»?«) to be 5991 BB. Also, since this is a 95 percent confidence interval with both an upside and a downside, aren’t you actually calculating a 2.5 percent risk of ruin since 2.5 percent of the time you can do better than the upper limit results (and now you won’t care about your bankroll requirements) which leaves only 2.5 percent for the downside? That is if you want to calculate a 5 percent risk of ruin, don’t you want to use a 90 percent confidence interval and not a 95 percent confidence interval?
Do you have sophisticated guesses for the STD of 6-max five-card Omaha? Maybe something like 200?
fafa
10. February 2016 11:48
jan , This is misleading, but in the 20 samples graph, the best and worst are run out of 1000 trials.
“Best / Worst: Best and worst run out of 1000 trials”
George Archer
11. January 2016 15:29
How do you define ‘Risk of Ruin’?
Presumable it’s the probability that a player loses there entire roll if they played the same stake and didn’t drop down?
If so how do you calculate ROR if they move down the stakes?
Marlon Rando
11. January 2016 06:32
Paul, it’s you and me buddy. This is cash all in pre since 11/29.
jan
9. January 2016 16:40
Hi,
I noticed that the 20 random graphs in cg variance simulator almost always have one graph that is outside of the 2 std deviation line.. 20 graphs, 1 should be over that 95% line sometimes right.. but not always.
How are the graphs calculated? just a std deviation calculation or something else?
Adrian
8. January 2016 09:34
How does run it twice affect this? is there any way to account for it?
But please make clear what BB/100 really means: for example my winrate in Pokertracker Big Blinds (PTBB) is 3 then i have to use the calculator with 6 BB/100???
Thanks for clarifikation.
Greetings M
Marlon Rando
23. November 2015 09:06
Q: Do you have any idea how awesome you are for putting this up for people?
A: All the way awesome.
Thanks Pokerdope 🙂
Jon
23. October 2015 17:04
Paul – Um, ouch?
Firstly note that the HM filter “Allin Preflop”=True is really “Got Allin With Someone Preflop” – 100% of these went to showdown (try adding “Hero saw flop”=False and note there are now zero hands).
So the EV you used does not include the folds you get when you shoved (otherwise you’d probably be making > 100 bb/100 EV).
With that caveat aside, as far as I can tell the numbers you used for EV and SD look reasonable (a 35%ish edge when getting it all in sounds about right for the ever-short-stacked hypers).
I don’t play many hyper STTs, mostly MTTs; my raw numbers using “Allin Preflop”=True are 7.5K hands @ 130.58 EV (134.08) with SD 219.30.
To get it slightly more in line with a hyper stt bubble environment I filtered “Stack” < 25BB and only co/btn/sb/bb and my numbers were 3.5K hands @ 75.19 EV (69.92) with SD 115.26 – both my actual rates are well within the 70% confidence intervals.
Jon
23. October 2015 15:13
Denis – It’s not a bug, no.
The 100% confidence interval would be the range all the way from losing every hand to winning every hand, which is as wide as it could get – you can be 100% confident that a trial will net something in that range.
An expected 5% of trials will net outside the bounds of the 95% interval; an expected 30% of trials will net outside the bounds of the 70% interval.
Denis
7. June 2015 12:37
Could someone please explain how could it be possible that 95% confidence interval is wider than 70% ? Is this a bug?
The range of outcomes is wider. Therefore they can more confidently say your outcome will be within (x) range (95%).
The 70% interval suggests a tighter range, but is less confident in that assumption becomes the outcomes are narrower.
Liam
25. March 2015 18:15
Hi,
What is the observed winrate?
Cheers
phina
16. January 2015 07:32
hey pokerdope,
I’m trying to figure out a fair cut for a cash game deal so i did this:
i added up all numbers from the 20 samples end results divided that number by 20 to get the average result…which should be round about the EV but its not even close…its always way less…i did that a couple of times even with samples that were looking good and its always way less than the EV…
if thats true that means the numbers of pokerdope are wrong isn’t it?
thx for help
Jean
14. January 2015 10:10
Hello, anyone can explain what observed winrate is? We have winrate and observed winrate, any differences?
Chris
19. August 2014 13:46
Am confused if the BB is big bet or big blind. I would assume it is big bet. But I look at this noah SD artical which would sugest a +/-8 Big Blinds for 50Kh, but according to this calculator it is about +/- 8 Big Bets over 50Kh(using an SD of 95)
“A 95% confidence interval for your winrate over 50k hands is going to span about 16 bb/100 (e.g. -8 bb/100 to 8 bb/100). So obviously your winrate over 50k hands doesn’t really say much.”
Would be greatful if you could tell me what i am miss understanding
R.K.
29. July 2014 22:02
The variance calc is complete non sense. It would be correct if online poker would work with correct and real life daily math, but since it doesnt, any calculation is a fail.
trixn
26. April 2014 03:23
@wiZ The numbers, u refer to only make sense if you entered an observed winrate. If your ture winrate is 2.5bb/100 then it is very unlikely you will run 10bb/100 (which is the observed winrate) over 100000 hands. if you chose the same winrates for the true and the observed winrate, then you will see, that it is 50%.
wiZ
5. April 2014 12:13
Hi Mitch, these is the complete overview of my calculations. (2,5 bb winrate, 10bb observed winrate, 100K hands, and 160 bb standard dev (PLO)).
can anyone tell me why it is statistically more likely to run BELOW EV than it is to run ABOVE/EQUAL TO EV??? Wow if someone could explain this to me I would be very grateful, right now I do not understand why it would be MORE likely to run below EV than at/above EV? Especially since, even though I am a small winner in my games, I am perpetually running below EV and my actual winnings should be much higher than they currently are. Thank you.
EV (»?«) 2.50 BB/100 Standard deviation (»?«) 160.00 BB/100 Hands(»?«) 100000 Expected winnings (»?«) 2500.00 BB Standard deviation after 100000 hands (»?«) 5060 BB 5.06 BB/100 70% confidence interval (»?«) [-2560 BB, 7560 BB] [-2.56 BB/100, 7.56 BB/100] 95% confidence interval (»?«) [-7619 BB, 12619 BB] [-7.62 BB/100, 12.62 BB/100] Probability of loss after 100000 hands (»?«) 31.0616% Probability of running at or above observed win rate (10.00 BB/100) over 100000 hands with a true win rate of 2.50 BB/100 (»?«) 6.9128% Probability of running below observed win rate (10.00 BB/100) over 100000 hands with a true win rate of 2.50 BB/100 (»?«) 93.0872% Minimum bankroll for less than 5% risk of ruin (»?«) 15338 BB
Michman
25. March 2014 12:44
Hi. How do you simulate the samples and how do you calculate the “confidence intervall”? Do you assume normal distribution?
wiZ
22. March 2014 18:24
Can anybody please explain to me why (if I interpreted the stats below correctly) it is more likely to run below EV (93,1)% than above/equal to EV (6,9%)over 100k hands? I always see people on the forums : ) say it is as likely to run below EV or above EV but this says otherwise. Help explaining this would be greatly appreciated.
Probability of running at or above observed win rate (10.00 BB/100) over 100000 hands with a true win rate of 2.50 BB/100 (»?«) 6.9128%
Probability of running below observed win rate (10.00 BB/100) over 100000 hands with a true win rate of 2.50 BB/100 (»?«) 93.0872%
notice 100% – 6.9128% = 93.0872% The probability in normaln distribution (which i assume is applied here) is symmetric 🙂
Alex
13. March 2014 11:05
Look, Andrey, you may start playing with your Min BR of 14979 with 5% risk of ruin at a certain distance, but the more you play there is the bigger chance to have a downswing of 15k bb. You see, those tables were simulated at the distance over 100 mil hands. So the smaller is your sample the less chance for you will be to ruin.
Andrey
12. February 2014 22:15
Could anybody explain me.. If I see this: Minimum bankroll for less than 5% risk of ruin (»?«)-14979 BB.
Do I understand right, when think, that I can lose my 14979 bankroll with a probability of 5%?
Then how can it be, that Downswing Extents : 15000+ BB 30.82% ? What does it mean?
Id say, losing 150bi bankroll with 5% prob assumes u get 150+ downswing at the very beginning of your journey. 150bi+ downswing can appear after u already build your roll exp: 150bi-> 200bi, so it wont kill ya 🙂
Alex
21. January 2014 09:33
bb means – Big Blinds and BB means Big Bets – standard abbreviation. Also HM2 has 2 different stats for std dev. One is bb per 100 hands and is as in examples. Another is just std dev. So the difference is like, eg, for midstack nlhe 65 vs 6.5. You may put in the description than you use std dev per 100 hands.
Also a qustsion: “Minimum bankroll for less than 5% risk of ruin” – does it mean that a player continues to play the same limit up to the end or that he goes down the limit at some point (eg, then he has the same amount of bb left for a lower limit)?
This website uses cookies to improve your experience. We'll assume you're ok with this, but you can opt-out if you wish. Cookie settingsACCEPT
Privacy & Cookies Policy
Privacy Overview
This website uses cookies to improve your experience while you navigate through the website. Out of these cookies, the cookies that are categorized as necessary are stored on your browser as they are essential for the working of basic functionalities of the website. We also use third-party cookies that help us analyze and understand how you use this website. These cookies will be stored in your browser only with your consent. You also have the option to opt-out of these cookies. But opting out of some of these cookies may have an effect on your browsing experience.
Necessary cookies are absolutely essential for the website to function properly. This category only includes cookies that ensures basic functionalities and security features of the website. These cookies do not store any personal information.
Any cookies that may not be particularly necessary for the website to function and is used specifically to collect user personal data via analytics, ads, other embedded contents are termed as non-necessary cookies. It is mandatory to procure user consent prior to running these cookies on your website.
Hello
I am a part of digital marketing strategy.We are providing the quality sites for guest posts. a If you are looking for guest posts sites ? then you are in the right place.
This guest post strategy increases your website traffic and visitors.
Just let me know which sites you are interested in and I will provide you my best.
Best Regards
Would it be possible to get the ability to set a target risk of ruin?
it would be really awesome if there was an option to input a bankroll amount and calculate the risk of ruin based on the input bankroll
You can calculate BR for RoR directly…
BR for 5% RoR = 1.5 * (std.dev)^2 / WR
For different RoRs, simply multiply by ln(RoR)/ln(.05)
So, 10 bb/100 WR at 100 bb/100 std. dev would result in:
1.5 * (100)^2 / 10 = 1500 bbs bankroll for 5% RoR
for 10% RoR, multiply by ln(.1)/ln(.05) = .7686
1500 * .7686 = 1153 bbs bankroll for 10% RoR
Hi would you be willing to add 3 sigma(99.7 %) below 70% and 95% confidence interval (»?«) ?
Hey,
What kind of stochastic process do you use to make these simulations?
Torsten
Hi Torsten, the calculator runs rather simple Monte Carlo simulations assuming that cash game results follow the normal distribution when repeated often enough and over a long enough time frame.
Great job on the tool! Maybe you could add an input box for rake or give choice to choose site / limits, tough of course it’s possible to just add the rake back to our win rate. Cheers
Thank you. 🙂
For variance purposes you should always consider your win rate with rake (and possible rake back) included.Otherwise you’d heavily overestimate your EV and underestimate the variance.
Is it possible to get Risk for ruin shown to 0%?
Is it possible to get it shown over a hand period?
Hi Katie,
A 0% risk of ruin at infinity is unachievable unless one starts with an infinite BR.
For risk of ruin shown over a hand period you can use the formula I gave in the comment below.
Sorry, where’s the formula?
Hi guys,
The risk of ruin you show is only at infinity, not for finite time.
Let
R = risk of ruin
s = standard deviation per hand = (standard deviation per 100) / 10
m = bb/hand
br = initial bankroll
Then the risk of ruin after n hands is given by:
R = 1 + exp(-2*m*br/s^2)*Phi((br + m*n)/sqrt(n*s^2)) – Phi((-br + m*n)/sqrt(n*s^2))
where Phi(x) is the standard normal cdf.
You can see that as n goes to infinity, R becomes the formula you use exp(-2*m*br/s^2).
Hi, adelarosa, thanks for your great answer.
Could you please provide a reference for the stated formula for finite n? I am eager to learn the fundamentals of this kind of computations.
Hi Edson,
You can find many references here https://en.wikipedia.org/wiki/Reflected_Brownian_motion
I have also attached a derivation I did a while ago.
can you do a version in spanish?? i
Unfortunately, right now there are no international version planned.
Thank you for this, it’s awesome I can see there’s a lot of time and effort that’s gone into it. Really cool.
Is there a calc that does this that shows the same but without rake?
Perhaps I’m missing the point but that would be a different curve no? Less Variance more winning?
Hi, thank you.
Well, yes, you can just add the rake to you win rate to see the difference. If you have a win rate of 3BB/100 and pay 5BB/100 rake, your win rate before rake is 8BB/100.
The variance is independent of your win rate though. Of course your EV will increase, but the size of the confidence intervals for example will stay the same.
Hi – does anyone know the standard deviation of evBB/100 hands for 6max no-limit? Seems like it should be less than the SD of winrates that aren’t adjusted for all-in equity.
Standard Deviation heavily depends on your play style. More aggressive players tend to have much higher SD/100 than super tight players.
I just went through my database with a couple of million cash game hands to get some detailed numbers about the standard deviation of all players in the database. (Regular cash game, not fast fold.) I filtered for number of players and removed all players with less than 1000 hands.
Those are the standard deviations the players in my database had:
Games with 2 players
Games with 6 players
Games with 9 players
95% Interval means that 95% of all players had a standard deviation between those two values.
As you can see, standard deviation doesn’t change much between 9 player games and 6 player games.
Edit: This didn’t really answer your question though.
Go into detail regarding the standard deviation when looking at evBB/100 is a bit tricky. Unfortunately, PokerTracker doesn’t have a StdDev(evBB/100) readily available.
But I think we can get a decent approximation when we just remove all hands with an all-in and call before the river when calculating the standard deviation. At least this will show the maximum impact all in hands have on the standard deviation.
In my database I have 3.06 Million hands (NL100) with 5 or 6 players. Only 29k of those (0.9%) had an all in before the river and a showdown.
Again I filtered for all player with at least 1k hands and removed all hands with all in before the river & showdown. Those are the numbers I got:
Hands with all in & showdown: 29,350
Hands without all in & showdown: 3,058,874
Meaning: We can compare this with the numbers above for Games with 6 players. StdDev(evBB/100) is at most 28BB/100 lower than StdDev(BB/100), on average not more than 19BB/100 lower.
Great, thanks for the prompt reply!
Thank you for that amazing tool, this is great ! 🙂
The simulator is not working. It’s blocked at 1 million hands.
Fixed. Should work now again.
it doesnt work! cant calculate anything!
Weird. I cleared the cache just in case. It should work. Try hard reloading the page (Ctrl-Shift-R) and see if that helps.
“In general these simulations underestimate the likelyhood and extent of downswings” Why is that?
Generally because players tend to play worse during down swings. Lower win rates drastically increase the Likelihood of extended down swings.
the number of tables change the results of the calculator? for how many tables is calculated the variance on this site?
What about rake and fee? Is it calculated?
Yes. The rake is already considered in the win rate. Your win rate should always be after the rake.
Hello, how identify “Winrate in BB / 100”?
Is it my EV?
“Winrate / 100” means how much you win over the course of 100 hands statistically. Winnings are measured in big blinds. Lets say you’ve played 10,000 hands of $1 / $2 NLH and won $500. That means you have won 250 big blinds over 10,000 hands. This is equal to 2.5 big blinds per 100 hands.
How do you calculate standard deviation after X hands?
standard deviation is constant, and for 6max cash is betwine 100-120
the standard deviation for a single outcome is always constant. What youre looking for is the standard deviation for the mean.
It follows the following formula:
Variance of the mean result after N hands = (1/(N squared)) * Variance of the sum
N would be the number of hands and the “variance of the sum” would be the sum of the variances of all the outcomes.
For example the variance for a single fair coin flip is 0.25. If you want to know the variance of the sum of 10 coin flips you do 0.25 * 10 = 2.5
2.5 is the variance of the sum of 10 coin flips.
The same goes for poker hands. The variance for 100 poker hands in NLH 6max is, say, 10000 (100 squared).
To calculate the variance of the sum for 10 thousand hands you have to think how many groups of 100 hands does 10000 have? well, 10000/100 = 100
There are 100 groups of 100 hands in 10000 hands, which also means there is 100 times the variance of the sum of 100 hands, so:
100 * 10000 = 1000000
One million is the variance of the sum of 10000 hands. You divide this number by N squared(10000 squared) and you get the variance of the mean:
1000000 / 100000000 = 0.01
0.01 is the variance of the mean for 10000 hands; which is the same as saying 0.01 is how much your observed results will differ from the mean when looking at a sample of 10000 hands.
as you increase the number of hands the variance of the mean approaches zero:
for 10000 hands = 0.01
for 100000 hands = 0.001
for 1000000 hands = 0.0001
etc.
Btw, industry standard is to use BB to describe “big bets” and bb to describe (big blinds). Everything is super misleading.
dont know in what industri is BB for big bets
sure maybe 45 years ago lol
hi
do i need to use ev adjusted winrate or winnings winrate? i am asking cause i am running way above ev at the moment.
thanks
Hi, using your adjusted winrate makes the results more accurate.
hi, can you explain me?
Bruce:
No. Did you forget that the Gamblking Theory book states:
Special Note: It has been pointed out to me by Bruce Zastera, one of the most knowledgeable posters on our forums at http://www.twoplustwo.com, that it is also possible to go broke before reaching the number of hours at which we evaluate the probability of a loss, as well as after that time, and this problem is more acute at the 95 percent level than I originally realized. This means that these tables are significantly underestimating by a factor of about 2 the amount of bankroll needed to only have a 5 percent chance of going broke. Fortunately, this problem mitigates as the probability of going broke is reduced. Thus the Bankroll Required to Assure a Win tables do contain solid estimates and produce a risk of ruin of approximately 1.1 percent, but the 95 percent tables should probably not be used.
Mason:
Of course I didn’t forget that note. I wrote some of it. It in no way changes the fact that the calculations in that section are no way to compute the bankroll requirement for a desired risk of ruin. That’s because the number of sigmas in your derivation does not translate to a probability of ruin, for the same reason that the 95% confidence interval in this blog has nothing to do with a 5% risk of ruin. Moreover, this fundamental problem does not “mitigate as the probability of going broke is reduced”. Your computation for the “bankroll required to assure a win” ignores 88% of the possible ways we can go broke. That number gets worse as the risk of ruin is reduced. I’m sure you understand that a mathematical model should capture the dominant effects rather than ignoring the dominant effect.
We need to be clear what was meant by “the problem mitigates as the probability of going broke is reduced”. The bankroll needed for a 5% risk of ruin is about 2.2 times the bankroll that your method would compute. If we want a 1% risk of ruin, the bankroll required is about 2 times what your method would compute. If we want a 0.13% risk of ruin, the bankroll required would be about 1.5 times what your method would compute. That’s about as small a risk of ruin as most people would care about, yet the bankroll is still off significantly. There’s not a lot of mitigation.
The actual risk of ruin produced by your bankroll in that last case, which you describe as “the bankroll required to assure a win”, would be about 1.1%, not 0.13%. The mitigating factor is that both of those numbers are relatively small. Lots of folks may not care if their risk of ruin is 1.1% or 0.13%, though I’m not sure everyone would describe a 1.1% risk of ruin as having assured a win. The 0.13% came from 3 standard deviations. You chose that as a way to include essentially all of a population as is common in statistics. Except you are considering the wrong population. We don’t want the population of positive results at a particular point in time assuming we can play through any draw down. We want the population of all random walks that never go broke. Using the former population for bankroll requirements and risk of ruin is mathematical nonsense.
BTW, the formula Pokerdope posted was well known long before Mathematics of Poker by Chen and Ankenman. It has been discussed by many at 2+2 since I introduced it there in the early 2000s or possibly even the late 1990s. It also appears in Douglas Zare’s poker book. Before that it was well known to the blackjack community, having appeared in papers by George C. and Patrick Sileo in 1989 and 1990 respectively . It was surely known in mathematics before that as the general expression is important in financial math, and it can also be obtained from the Weiner process. Deriving it from scratch isn’t that hard, but if you want a rigorous examination of the conditions under which it applies and how to modify it when those conditions don’t apply, see the essay “Gambler’s Ruin Revisited” in the book Optimal Play. There is also an analytical short term ruin formula for risk of ruin in a finite number of hands. I’ve only recently found a derivation of that one, and it is quite involved but still fairly accessible. Of course it’s quite straightforward to simulate these results to verify the accuracy of the formulas under a variety of conditions.
Bruce:
It’s good to see you back in these type of discussions. It’s a shame we don’t get to see more of your input as we once did.
Mason
@Mason Malmuth:
The confidence intervals in his graph have nothing to do with risk of ruin. His graph is showing you a range of results assuming you can play through any drawdowns. IOW, if you lose your 5991 at some point, you can still keep playing, as if someone lent you additional funds. The positive portion of the graph includes the times you lost your bankroll and then recovered to finish positive. The risk of ruin formula as correctly given by Pokerdope counts these instances as a failure. A risk of ruin formula is not and cannot be based on confidence intervals.
Attempting to use confidence intervals to compute risk of ruin is a well known blunder. It is why the bankrolls in your book Gambling Theory and Other Topics for a 5% risk of ruin would actually give a 26% risk of ruin as was discussed on your site back in 2003 and countless times since on your Probability forum:
http://archives2.twoplustwo.com/showflat.php?Cat=0&Number=207100&page=0&fpart=all&vc=1
Here is a derivation of the risk of ruin formula Pokerdope gave which has been simplified to require nothing more than high school algebra:
http://archives2.twoplustwo.com/showthreaded.php?Cat=&Number=683150&page=0&view=expanded&sb=5&o=14&fpart=2#Post682045683150
BTW, we developed a similar variance calculator on your site for tournaments which requires a different approach to risk of ruin.. It doesn’t have a web interface as of yet. It runs in R which is a platform for statistical computing which free and very easy to install. Here is a link to the script.
http://forumserver.twoplustwo.com/showpost.php?p=37999024&postcount=26
The images of the graphical output are broken on your site, but they looked like this
https://drive.google.com/open?id=0B4WGSVwiTxCDa1BnUUZ3R2RId0k
along with some separate textual output including both analytical and simulated statistics.
Thank you for answering my question. But since you’re showing a 95 percent confidence interval, aren’t you actually showing a graph that would correspond with a 2.5 percent risk of ruin while you’re using a formula that calculates a 5 percent risk of ruin? Put another way, wouldn’t a 90 percent confidence interval be the correct interval to use instead of the 95 percent confidence interval since 5 percent of the time your result will be above the confidence interval (and here you don’t care about bankroll since you’re such a big winner) but on the other hand, 5 percent of the time your result will be below the interval and that is what you’re interested in,.
In your example of a 2.5 BB winrate per 100 hands and a standard deviation of 100 BB per 100 hands how did you calculate (or estimate) the Minimum bankroll for less than 5% risk of ruin (»?«) to be 5991 BB. Also, since this is a 95 percent confidence interval with both an upside and a downside, aren’t you actually calculating a 2.5 percent risk of ruin since 2.5 percent of the time you can do better than the upper limit results (and now you won’t care about your bankroll requirements) which leaves only 2.5 percent for the downside? That is if you want to calculate a 5 percent risk of ruin, don’t you want to use a 90 percent confidence interval and not a 95 percent confidence interval?
The risk of ruin and the necessary bankroll is calculated independently from the confidence interval.
Risk of ruin is calculated using this formula:
r = exp ( -2 * WR * BR / V )
where:
r: Risk of Ruin
WR: Win Rate
BR: Bankroll
V: Variance
A good explanation for this formula can be found in Mathematics of Poker [p281ff]
Solving this for BR gives
BR = -log (r) * V / ( 2 * WR)
Hi Arved:
I think you have a type-o in your bankroll formula. It should be
BR = [ln(R) * Var] / (-2*WR)
where:
BR is the required bankroll,
R is the risk of ruin,
Var is the variance which is the standard deviation squared, and
WR is the winrate.
Using the example above with a win rate of 2.5 per 100 hands, a standard deviation of 100 BB per 100 hands, and a risk of ruin of 0.05 we get:
BR = [ln(0.05) * 100 * 100] / [(-2 * 2.5)]
= [(-2.9957)(100)(100)] / [(-2 * 2.5)]
= 5991
and which matches the minimum bankroll given in the example.
Ah, right. Thank you. Fixed now.
Hi,
Do you have sophisticated guesses for the STD of 6-max five-card Omaha? Maybe something like 200?
jan ,
This is misleading, but in the 20 samples graph, the best and worst are run out of 1000 trials.
“Best / Worst: Best and worst run out of 1000 trials”
How do you define ‘Risk of Ruin’?
Presumable it’s the probability that a player loses there entire roll if they played the same stake and didn’t drop down?
If so how do you calculate ROR if they move down the stakes?
Paul, it’s you and me buddy. This is cash all in pre since 11/29.
Hi,
I noticed that the 20 random graphs in cg variance simulator almost always have one graph that is outside of the 2 std deviation line..
20 graphs, 1 should be over that 95% line sometimes right.. but not always.
How are the graphs calculated? just a std deviation calculation or something else?
How does run it twice affect this? is there any way to account for it?
it will reduce the standard deviations
Hello,
nice tool!
But please make clear what BB/100 really means:
for example my winrate in Pokertracker Big Blinds (PTBB) is 3 then i have to use the calculator with 6 BB/100???
Thanks for clarifikation.
Greetings
M
Q: Do you have any idea how awesome you are for putting this up for people?
A: All the way awesome.
Thanks Pokerdope 🙂
Paul – Um, ouch?
Firstly note that the HM filter “Allin Preflop”=True is really “Got Allin With Someone Preflop” – 100% of these went to showdown (try adding “Hero saw flop”=False and note there are now zero hands).
I can’t see a filter for precisely what we’d want here to include our realised fold equity, and also found this: http://forums.holdemmanager.com/manager-general/137851-open-shove-filter.html
So the EV you used does not include the folds you get when you shoved (otherwise you’d probably be making > 100 bb/100 EV).
With that caveat aside, as far as I can tell the numbers you used for EV and SD look reasonable (a 35%ish edge when getting it all in sounds about right for the ever-short-stacked hypers).
I don’t play many hyper STTs, mostly MTTs; my raw numbers using “Allin Preflop”=True are 7.5K hands @ 130.58 EV (134.08) with SD 219.30.
To get it slightly more in line with a hyper stt bubble environment I filtered “Stack” < 25BB and only co/btn/sb/bb and my numbers were 3.5K hands @ 75.19 EV (69.92) with SD 115.26 – both my actual rates are well within the 70% confidence intervals.
Denis – It’s not a bug, no.
The 100% confidence interval would be the range all the way from losing every hand to winning every hand, which is as wide as it could get – you can be 100% confident that a trial will net something in that range.
An expected 5% of trials will net outside the bounds of the 95% interval; an expected 30% of trials will net outside the bounds of the 70% interval.
Could someone please explain how could it be possible that 95% confidence interval is wider than 70% ? Is this a bug?
The range of outcomes is wider. Therefore they can more confidently say your outcome will be within (x) range (95%).
The 70% interval suggests a tighter range, but is less confident in that assumption becomes the outcomes are narrower.
Hi,
What is the observed winrate?
Cheers
hey pokerdope,
I’m trying to figure out a fair cut for a cash game deal so i did this:
i added up all numbers from the 20 samples end results divided that number by 20 to get the average result…which should be round about the EV but its not even close…its always way less…i did that a couple of times even with samples that were looking good and its always way less than the EV…
if thats true that means the numbers of pokerdope are wrong isn’t it?
thx for help
Hello,
anyone can explain what observed winrate is? We have winrate and observed winrate, any differences?
Am confused if the BB is big bet or big blind. I would assume it is big bet. But I look at this noah SD artical which would sugest a +/-8 Big Blinds for 50Kh, but according to this calculator it is about +/- 8 Big Bets over 50Kh(using an SD of 95)
“A 95% confidence interval for your winrate over 50k hands is going to span about 16 bb/100 (e.g. -8 bb/100 to 8 bb/100). So obviously your winrate over 50k hands doesn’t really say much.”
http://www.nsdpoker.com/2011/03/nlhe_6m_pros/
Would be greatful if you could tell me what i am miss understanding
The variance calc is complete non sense. It would be correct if online poker would work with correct and real life daily math, but since it doesnt, any calculation is a fail.
@wiZ
The numbers, u refer to only make sense if you entered an observed winrate. If your ture winrate is 2.5bb/100 then it is very unlikely you will run 10bb/100 (which is the observed winrate) over 100000 hands. if you chose the same winrates for the true and the observed winrate, then you will see, that it is 50%.
Hi Mitch, these is the complete overview of my calculations. (2,5 bb winrate, 10bb observed winrate, 100K hands, and 160 bb standard dev (PLO)).
can anyone tell me why it is statistically more likely to run BELOW EV than it is to run ABOVE/EQUAL TO EV??? Wow if someone could explain this to me I would be very grateful, right now I do not understand why it would be MORE likely to run below EV than at/above EV? Especially since, even though I am a small winner in my games, I am perpetually running below EV and my actual winnings should be much higher than they currently are. Thank you.
EV (»?«) 2.50 BB/100
Standard deviation (»?«) 160.00 BB/100
Hands(»?«) 100000
Expected winnings (»?«) 2500.00 BB
Standard deviation after 100000 hands (»?«) 5060 BB
5.06 BB/100
70% confidence interval (»?«) [-2560 BB, 7560 BB]
[-2.56 BB/100, 7.56 BB/100]
95% confidence interval (»?«) [-7619 BB, 12619 BB]
[-7.62 BB/100, 12.62 BB/100]
Probability of loss after 100000 hands (»?«) 31.0616%
Probability of running at or above observed win rate (10.00 BB/100) over 100000 hands with a true win rate of 2.50 BB/100 (»?«) 6.9128%
Probability of running below observed win rate (10.00 BB/100) over 100000 hands with a true win rate of 2.50 BB/100 (»?«) 93.0872%
Minimum bankroll for less than 5% risk of ruin (»?«) 15338 BB
Hi. How do you simulate the samples and how do you calculate the “confidence intervall”? Do you assume normal distribution?
Can anybody please explain to me why (if I interpreted the stats below correctly) it is more likely to run below EV (93,1)% than above/equal to EV (6,9%)over 100k hands? I always see people on the forums : ) say it is as likely to run below EV or above EV but this says otherwise. Help explaining this would be greatly appreciated.
Probability of running at or above observed win rate (10.00 BB/100) over 100000 hands with a true win rate of 2.50 BB/100 (»?«) 6.9128%
Probability of running below observed win rate (10.00 BB/100) over 100000 hands with a true win rate of 2.50 BB/100 (»?«) 93.0872%
notice 100% – 6.9128% = 93.0872%
The probability in normaln distribution (which i assume is applied here) is symmetric 🙂
Look, Andrey, you may start playing with your Min BR of 14979 with 5% risk of ruin at a certain distance, but the more you play there is the bigger chance to have a downswing of 15k bb. You see, those tables were simulated at the distance over 100 mil hands. So the smaller is your sample the less chance for you will be to ruin.
Could anybody explain me.. If I see this: Minimum bankroll for less than 5% risk of ruin (»?«)-14979 BB.
Do I understand right, when think, that I can lose my 14979 bankroll with a probability of 5%?
Then how can it be, that Downswing Extents : 15000+ BB 30.82% ?
What does it mean?
Id say, losing 150bi bankroll with 5% prob assumes u get 150+ downswing at the very beginning of your journey.
150bi+ downswing can appear after u already build your roll exp: 150bi-> 200bi, so it wont kill ya 🙂
bb means – Big Blinds and BB means Big Bets – standard abbreviation. Also HM2 has 2 different stats for std dev. One is bb per 100 hands and is as in examples. Another is just std dev. So the difference is like, eg, for midstack nlhe 65 vs 6.5. You may put in the description than you use std dev per 100 hands.
Also a qustsion: “Minimum bankroll for less than 5% risk of ruin” – does it mean that a player continues to play the same limit up to the end or that he goes down the limit at some point (eg, then he has the same amount of bb left for a lower limit)?
BB means “Big Blinds”.
But nothing changes if you treat it as Big Bets though.
Hello! Awesome calculator! Are the BBs big bets or big blinds? Was not sure about that.
Hi Guys, any help for winrate in BB/100. Is it big blinds or big bets?
it changes massively u dingbat