
The Poker Tournament Variance Simulator calculates variance for poker tournaments, MTTs and SNGs. Enter your tournament(s), hit calculate and let the simulator do its magic. An explanation how this simulator works can be found below.
Beta Test: Please note that this Tournament Variance Calculator is in ongoing beta. In case of errors, or malfunctions or if you have feature requests, send me a note at info@primedope.com.
If nothing works, you can still access the old Tournament Variance Calculator:
How does the Poker Tournament Variance Calculator work?
Let’s go through an example simulation.
First, you need to enter the poker tournament (or SNG / Sit-and-Go) schedule. Let’s say you’re playing a $215 tournament regularly and want to check what variance you can expect. That’s what the settings can look like:
Settings
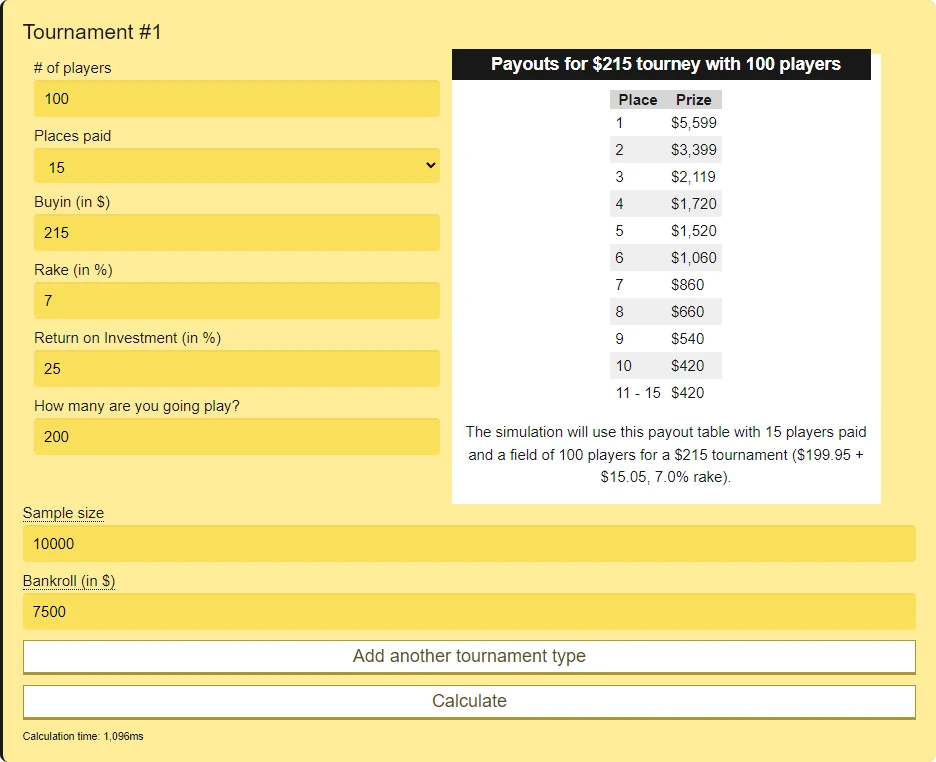
- Players: Number of players for the tournament. We assumed 100 players (entries) for this tournament.
- Structure: How many places get paid. Standard payout tables are used.
- Buy-in and Rake: In any currency, you fancy (we just use the $ symbol) – buyin must be greater than zero. Buy-In for the example event is $215 and the rake is 7%.
- ROI: In percent, any value is ok. Let’s just assume, we have an ROI of 25% in this tournament.
- How many are you going to play?: How many tournaments should be simulated. For this example, we want to know what results we can expect over the course of 200 events.
- Sample size: How many samples should be simulated – higher numbers yield more accurate results, but also take longer to compute.
- Bankroll: Can be left blank and is only used when calculating the risk of ruin.
Click on Calculate and the Poker Variance Calculator does its magic. It simulates whatever tournament schedule you have entered over as many samples as you have entered. In our example, it would simulate 200 tournaments 10,000 times.
Distribution and Random Samples
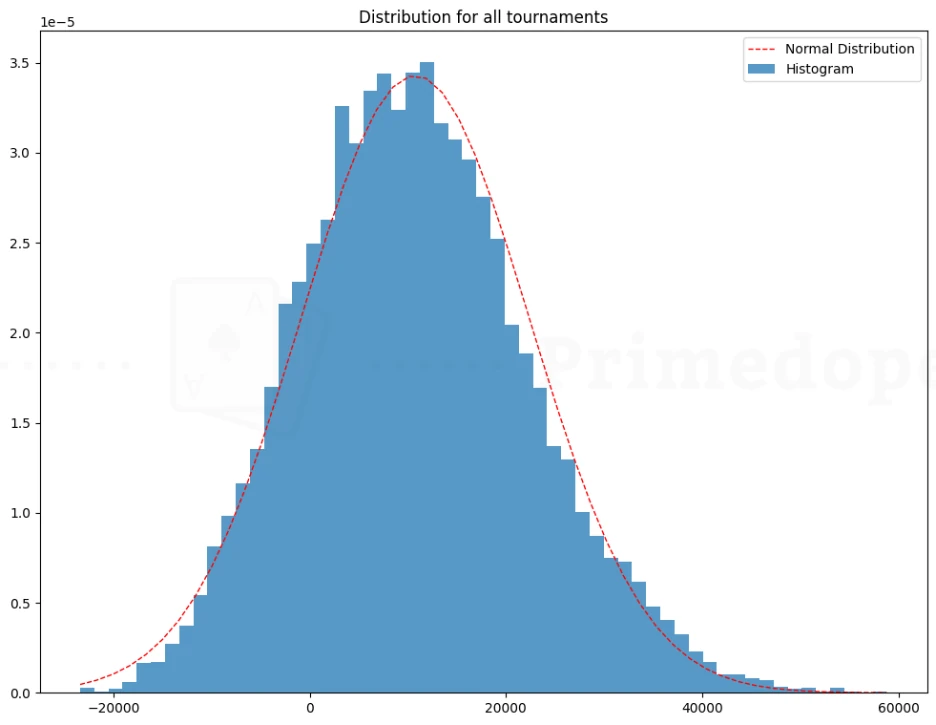
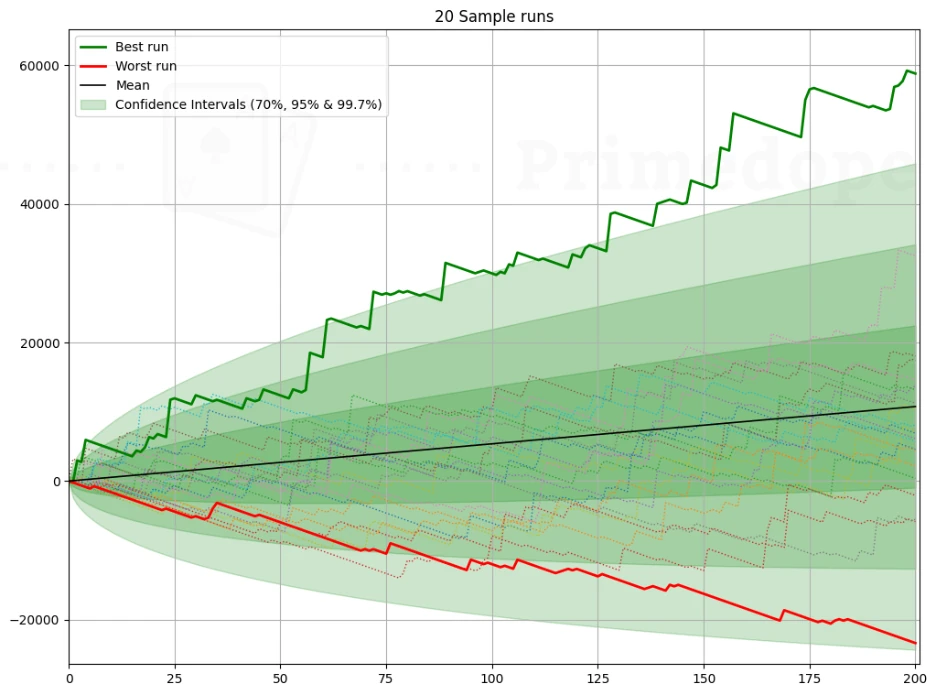
The distribution shows the likelihood function for the results. The random samples show 20 random runs plus the best and worst run out of all 10,000 samples. The green areas are the confidence intervals where the results will land with a probability of 70%, 95% and 99.7%.